Published: January 27, 2009
By Richard G. Baldwin
Java Programming Notes # 350
This lesson is the next in a series (see Resources) designed to teach you how to write Java programs to do things like:
If you have ever wondered how to do these things, you've come to the right place.
You've been working very hard if you have studied all of the earlier lessons in this series (see Resources). You have learned all about the Turtle class, its superclass named SimpleTurtle, and the classes from which a turtle's contained objects are instantiated (Pen and PathSegment).
You have learned how to instantiate new Turtle objects, placing them in either a World object or a Picture object. You have learned how to manipulate the Turtle objects once you place them in their environment.
It's time to take a break and have some fun by writing non-trivial programs that make use of what you have learned so far. That's what we are going to do in this lesson.
I recommend that you open another copy of this document in a separate browser window and use the following links to easily find and view the figures and listings while you are reading about them.
I recommend that you also study the other lessons in my extensive collection of online programming tutorials. You will find a consolidated index at www.DickBaldwin.com.
In this series of lessons, I will present and explain many of the classes in a multimedia class library that was developed and released under a Creative Commons Attribution 3.0 United States License (see Resources) by Mark Guzdial and Barbara Ericson at Georgia Institute of Technology. In doing this, I will also present some interesting sample programs that use the library.
I explained how to download, install, and test the multimedia class library in an earlier lesson titled Multimedia Programming with Java, Getting Started (see Resources).
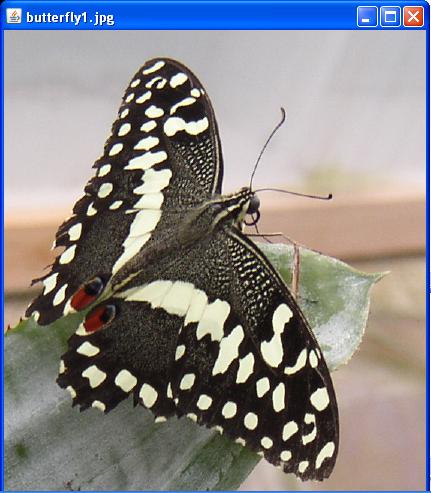
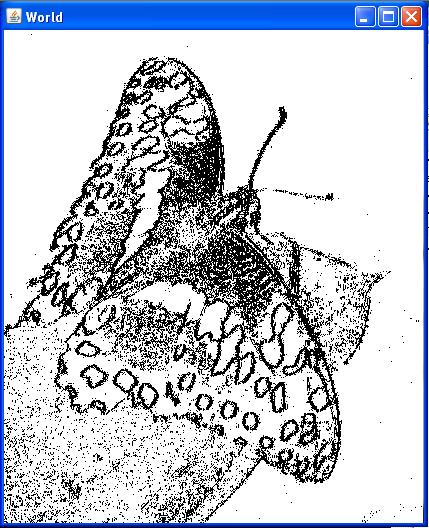
I will present and explain four different programs in this lesson. The last program will teach you one of several ways to do edge detection on an image. By edge detection, I mean the ability to convert the image shown in Figure 1 into the image shown in Figure 2.
Figure 1. Raw image from the program named Java350d.
|
|
Figure 2. Final output from the program named Java350d.
|
|
A black and white pencil drawing
As you can see, this form of edge detection converts a full-colored photographic image into something that resembles a black and white pencil drawing. While you may not be anxious to convert your digital images of friends and family to pencil drawings, understanding how this is done will help you to understand a great deal about image manipulation in general as well as image manipulation using Ericson's multimedia Java library.
Before you can understand how to do edge detection using this approach, you must first understand the concept of color distance.
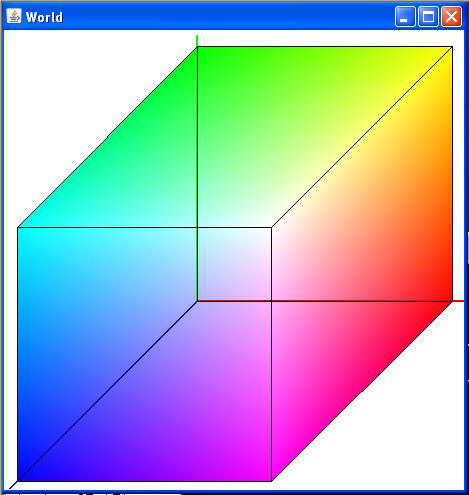
I will begin by explaining the concept of color distance using a 3D color cube as a model. Therefore, in addition to learning how to do edge detection, you will also learn how to project 3D coordinate values onto a 2D display and how to color the surfaces of a 3D color cube as shown in Figure 3.
Figure 3. Screen output from the program named Java350a.
|
|
It will be much easier to understand the concept of color distance by beginning with some very simple synthetic images. Therefore, the second program that I will explain creates an image containing several groups of adjacent black pixels on a white background. Then the program computes and plots the color distance between each pair of adjacent pixels moving from left to right across the image along a row of pixels.
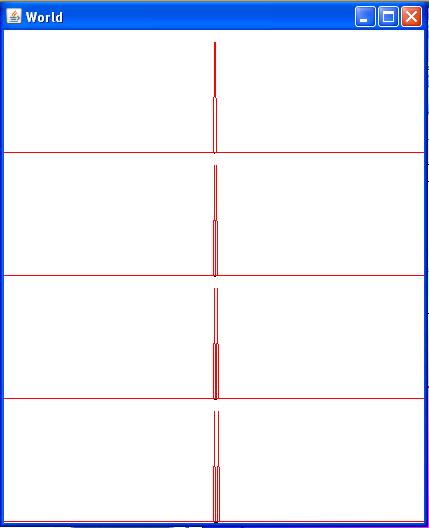
The interesting results occur where there is a white pixel adjacent to a black pixel at each end of each group of black pixels. The results are shown in Figure 4.
Figure 4. Screen output from the program named Java350b.
|
|
Look very closely
If you look very closely, you will see a single black pixel immediately below the center of the red line near the top of Figure 4. Similarly, if you look closely, you will also see a row of four black pixels below the center of the bottom red line. There are also rows of two and three black pixels immediately below the center of the second and third red lines respectively.
The red lines in Figure 4 plot the value of the color distance between pairs of adjacent pixels. The color distance between two white pixels is zero, and the color distance between two black pixels is zero. However, the value of the color distance between a white pixel and a black pixel is large as Figure 4 indicates. (I will tell you how large later in this lesson.)
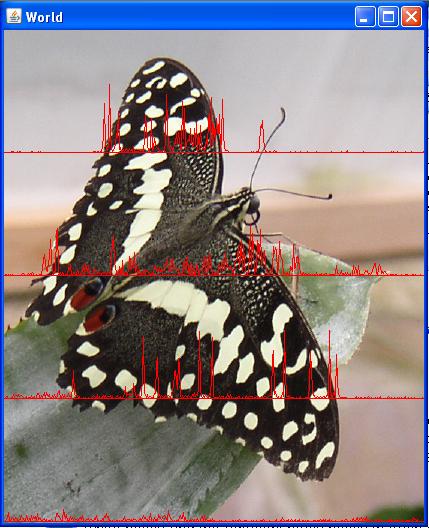
Figure 5 shows the same color-distance computation applied to an image of a butterfly instead of being applied to a simple synthetic image as was the case in Figure 4.
Figure 5. Screen output from the program named Java350c.
|
|
Plots of the color-distance values
Each of the red lines in Figure 5 plots the color distance values between each successive pair of pixels, moving from left to right across a row of pixels. As you can see, there are strong peaks at each point where there is an abrupt change in color, (as when the color changes from dark gray to almost white for example). Less abrupt changes in color result in lower peaks. There are few, if any peaks in those areas where the color is generally the same.
Once you understand how the results shown in Figure 5 were obtained, you will also be in a position to understand how the results shown in Figure 2 were obtained.
Before you can understand how to do edge detection using color distance as the determining factor, you must first understand the concept of color distance.
Color distance and a 3D cube
I will begin by explaining the concept of color distance using a 3D cube as a model. (In addition to learning how to do edge detection in this lesson, you will also learn how to project 3D coordinate values onto a 2D display.) You will also learn how to color the visible surfaces of a 3D cube as shown in Figure 3.
You can think of the red, green, and blue color-component values in a Color object as representing a single point in 3D space, where the three axes are red, green, and blue. Given that each color-component value ranges between 0 and 255, the set of all possible combinations of the three colors fall within a 3D cube with dimensions of 256 along each edge as shown in Figure 3.
The color black is at the origin
The color black with RGB values of 0,0,0 is a point at the origin of the 3D color space. (The color black is not visible in Figure 3 because the origin is on the back face of the cube. Only the front, top, and right side faces of the cube are visible in Figure 3.)
Yellow and white
The color yellow, represented by the RGB value 255,255,0 appears at the top back right-hand corner of Figure 3. Similarly, the color white, represented by the RGB value 255,255,255 appears at the top front right-hand corner in Figure 3.
Colors of the eight vertices
The eight vertices of the cube in Figure 3 represent the following color values:
More than 16-million colors
Every one of more than 16-million possible colors is represented by a point that is either inside the cube or on one of the faces of the cube in Figure 3.
The color distance
The color distance between two pixels is the positive length of a line segment that connects two points in Figure 3, where each point represents the color of a pixel. (I will explain later how you can compute the length of that line segment.) It should be clear, however, that the largest possible color distance is represented by a line segment that extends diagonally through the cube from one vertex to another. One such diagonal line extends from the origin (black) to the upper-right corner (white). Another extends from the blue vertex to the yellow vertex, and a third extends from the magenta vertex to the green vertex. The length of each such diagonal line segment is approximately 441 units.
Behavior and purpose of the program
This program creates and displays the 3D color cube shown in Figure 3. The cube displays shows various combinations of red, green, and blue on the top face, the front face, and the right-most face of the cube.
The purpose of the program is to provide a springboard for discussing the concept of the distance between two colors as points in 3D space.
The 3D space and cube parameters
The positive red axis is toward the right as shown by the tiny stub protruding from the cube on the right side of Figure 3. The positive green axis is up, and the positive blue axis protrudes toward the left side of the viewer.
The type of projection that was used to project the 3D coordinate data onto the 2D display is a Cavalier projection with the angle phi equal to 45 degrees. (See Classification of 3D to 2D projections in Resources, for more information on projection types.)
Will discuss in fragments
A complete listing of this program is provided in Listing 17 near the end of the lesson. As is my practice, I will discuss and explain the program in fragments, beginning with the fragment in Listing 1.
Listing 1. Beginning of the program named Java350a.
import java.awt.*;

public class Main{
  public static void main(String[] args){
    new Runner().run();
  }//end main
}//end class Main
|
The code in Listing 1 is straightforward and shouldn't require an explanation.
Beginning of the class named Runner
Listing 1 instantiates a new object of the class named Runner and calls a method named run on that object. The class named Runner begins in Listing 2.
Listing 2. Beginning of the class named Runner.
class Runner{
  final double sin45 = 0.7071067811865476;
  final double cos45 = 0.7071067811865476;
  final int width = 460;
  final int height = 460;
  final int originX = (int)(0.42*width);
  final int originY = (int)(0.59*height);
  World mars = null;
|
Listing 2 declares and initializes several constants along with one instance variable. These constants and the variable are used later in the program.
Projecting 3D coordinate values onto a 2D display plane
Listing 3 shows two methods that are used to project a 3D coordinate value onto a 2D display plane. The method named p3dX receives the 3D coordinates of a point in the RGB color space and returns the x-axis coordinate at which the point should be located on the 2D display plane.
Listing 3. Methods to project 3D coordinate value onto 2D plane.
  int p3dX(int red,int green,int blue){
    return (int)(red-blue*sin45);
  }//end p3Dx
  //----------------------------------------------------//

  int p3dY(int red,int green,int blue){
    //Reverse the sign to account for the fact that
    // positive y-coordinates go down the screen
    return -(int)(green-blue*cos45);
  }//end p3dY
|
Similarly, the method named p3dY receives the 3D coordinates of a point in RGB color space, and returns the y-axis coordinate at which the point should be located on the 2D display plane.
Both methods must be called with the coordinates of the point in 3D color space to determine the x and y coordinates at which the point should be located on the 2D display plane.
An exercise for the student
As you can see, each of the methods in Listing 3 consists of a single statement. I'm not going to try to explain why these mathematical expressions succeed in projecting a 3D coordinate value onto a 2D display plane. I'll leave that as an exercise for the student. Just be aware that there are several different ways to project a 3D coordinate value onto a 2D display plane and this is only one of those ways. (See Classification of 3D to 2D projections in Resources, for example.)
Beginning of the run method
As you saw in Listing 1, the main method in this program instantiates a new object of the Runner class and calls the run method on that object. The beginning of the run method is shown in Listing 4.
Listing 4. Beginning of the run method.
  void run(){
    //Create a new World object.
    mars = new World(width,height);

    //Place a new turtle on the right edge of the World
    // and make it invisible.
    Turtle joe = new Turtle(width,originY,mars);
    joe.setVisible(false);

    //Draw colored axes and black lines that outline the
    // cube.
    drawLines(joe);
|
Everything in Listing 4 down to the call to the method named drawLines should be familiar to you by now, so I won't discuss it further. However, the drawLines method is new, so I will put the explanation of the run method on hold temporarily and explain the drawLines method.
The drawLines method
The drawLines method, which begins in Listing 5, is rather long and boring, so I broke it out into a separate method simply to improve the organization of the program.
|
Note that the drawLines method receives a reference to the Turtle object that was instantiated in Listing 4 and which was placed at the right edge of the World object immediately to the right of the origin of the 3D projection shown in Figure 3.
Listing 5. Beginning of the drawLines method.
  void drawLines(Turtle joe){
    //Draw red x-axis by moving the turtle from the right
    // edge to the origin of the 3D world.
    joe.setPenWidth(2);//Draw the colored axes wide.
    joe.setPenColor(Color.RED);
    joe.moveTo(p3dX(0,0,0)+originX,p3dY(0,0,0)+originY);

    //Draw green y-axis by moving the turtle to near the
    // top edge of the 3D world and then return to the
    // origin.
    joe.setPenColor(Color.GREEN);
    joe.moveTo(p3dX(0,265,0)+originX,
               p3dY(0,265,0)+originY);
    joe.moveTo(p3dX(0,0,0)+originX,
               p3dY(0,0,0)+originY);

    //Draw blue z-axis and return turtle to the origin of
    // the 3D world.
    joe.setPenColor(Color.BLUE);
    joe.moveTo(p3dX(0,0,265)+originX,
               p3dY(0,0,265)+originY);
    joe.moveTo(p3dX(0,0,0)+originX,
               p3dY(0,0,0)+originY);
|
Draw the colored 3D axes lines
The purpose of the code in Listing 5 is to draw colored lines that represent the axes in 3D space. (The ends of those axes can be seen protruding from the right, front, and top of the cube in Figure 3.)
The lines are drawn by causing the turtle to move from one location to another and causing the turtle tracks to be visible. The colors of the turtle tracks are controlled by calls to the turtle's setPenColor method. The width of the lines is set to two pixels by a call to the turtle's setPenWidth method. I explained both of these methods in the previous lesson. (See The Pen and PathSegment Classes in Resources.)
An illusion of transparency
Note that because of the sequence in which the world repaints itself, with the historical turtle tracks being drawn last, these lines are drawn on top of the colored pixels that color the sides of the cube in Figure 3. (I also explained the sequence in which the world repaints itself in an earlier lesson.) This makes it look as though the faces of the cube in Figure 3 are transparent, allowing the lines to show through the faces of the cube.
Projecting the line's coordinates onto the 2D display plane
The turtle's moveTo method, which is called several times in Listing 5, knows nothing about 3D space. Rather, it requires a pair of x and y coordinate values on the 2D display plane.
Each time the moveTo method is called in Listing 5, calls to the p3Dx and p3Dy methods (see Listing 3) are made to project the 3D coordinate values that define the end of the move to coordinates on the 2D display plane. Then the values of the constants named originX and originY are added to the 2D coordinate values to translate the origin in 3D space from the upper-left corner of the 2D display plane to the location shown in Figure 3.
Draw black lines that outline the cube
The purpose of the code in Listing 6 is to draw the black lines that outline the cube shown in Figure 3. If you understand the code in Listing 5, you should have no problems with the code in Listing 6.
Listing 6. Draw black lines that outline the cube.
    joe.setPenWidth(1);//Draw narrow black lines.
    joe.setPenColor(Color.BLACK);

    //Draw four lines that outline the base of a cube. The
    // size of the cube is 256 pixels on each side.
    joe.moveTo(p3dX(0,0,255)+originX,
               p3dY(0,0,255)+originY);
    joe.moveTo(p3dX(255,0,255)+originX,
               p3dY(255,0,255)+originY);
    joe.moveTo(p3dX(255,0,0)+originX,
               p3dY(255,0,0)+originY);
    joe.moveTo(p3dX(0,0,0)+originX,
               p3dY(0,0,0)+originY);

    //Move up and draw four lines that outline the top of
    // the cube.
    joe.moveTo(p3dX(0,255,0)+originX,
               p3dY(0,255,0)+originY);
    joe.moveTo(p3dX(0,255,255)+originX,
               p3dY(0,255,255)+originY);
    joe.moveTo(p3dX(255,255,255)+originX,
               p3dY(255,255,255)+originY);
    joe.moveTo(p3dX(255,255,0)+originX,
               p3dY(255,255,0)+originY);
    joe.moveTo(p3dX(0,255,0)+originX,
               p3dY(0,255,0)+originY);

    //Draw three vertical lines at the corners.
    joe.moveTo(p3dX(0,255,255)+originX,
               p3dY(0,255,255)+originY);
    joe.moveTo(p3dX(0,0,255)+originX,
               p3dY(0,0,255)+originY);

    joe.moveTo(p3dX(255,0,255)+originX,
               p3dY(255,0,255)+originY);
    joe.moveTo(p3dX(255,255,255)+originX,
               p3dY(255,255,255)+originY);

    joe.moveTo(p3dX(255,255,0)+originX,
               p3dY(255,255,0)+originY);
    joe.moveTo(p3dX(255,0,0)+originX,
               p3dY(255,0,0)+originY);

  }//end drawLines
|
Listing 6 also signals the end of the method named drawLines.
Return to the method named run
Now, returning to the method named run that began in Listing 4, Listing 7 paints the top surface of the cube shown in Figure 3.
Listing 7. Paint the top surface of the cube.
    //Paint the top of the cube. Begin by getting a
    // reference to the Picture object that belongs to the
    // world by default.
    Picture picture = mars.getPicture();

    Pixel pixel = null;//a working variable

    for(int blu = 0;blu < 256;blu++){
      for(int rd = 0;rd < 256;rd++){
        //Hold the green coordinate constant.
        int grn = 255;
        pixel = picture.getPixel(p3dX(rd,grn,blu)+originX,
                                p3dY(rd,grn,blu)+originY);
        pixel.setColor(new Color(rd,grn,blu));
      }//end for loop
    }//end outer loop
|
The background image of a World object
As you will learn when I explain the World class in a future lesson, every World object contains a reference to an object of the class named Picture. (Picture is a large and complex class that I will also explain in a future lesson.) As the name implies, the Picture object provides a background image for the world.
By default, the background image is simply all white. However, as you can see in Figure 5, the default all-white background image can be replaced by any image that we want to place there.
In this program, we begin with an all-white default background image and change the colors of selected pixels to produce the image shown in Figure 3. (Note however, that as I explained in an earlier lesson, turtle tracks do not become a permanent part of the background image of a World object.)
Paint the top surface of the cube
Listing 7 begins by getting a reference to the world's Picture object. Then Listing 7 uses a pair of nested for loops to change the color of every pixel on the top surface of the cube. As before, calls to the methods named p3dX and p3dY are called to project 3D coordinate values on the top surface of the cube to x and y coordinate values on the 2D display plane.
The set of all possible 3D color coordinates for which...
The top plane of the cube in Figure 3 represents the set of all possible 3D color coordinates for which the green or vertical coordinate value is held constant at a value of 255.
Hence the code in Listing 7 iterates through all possible combinations of red, green, and blue for a constant value of 255 for green. (There are 65,536 such coordinates.)
This process results in a color of pure green at the top back left corner of the cube in Figure 3 and a color of white at the top front right corner of the cube. Similarly, it results in a color of yellow at the top back right corner and a color of cyan at the top front left corner.
Changing the color of a pixel
As mentioned earlier, the color of every pixel in the default background picture of a World object is white. The picture's getPixel method is called repeatedly in Listing 7 to get access to the individual pixels that make up the top surface of the cube. The pixel's setColor method is called to set the color component values for each pixel to the desired values.
Paint the front and right surfaces of the cube
Listing 8 uses code similar to the code in Listing 7 to paint the front and right surfaces of the cube in Figure 3.
Listing 8. Paint the front and right surfaces of the cube.
    //Paint the front surface of the cube
    for(int grn = 0;grn < 256;grn++){
      for(int rd = 0;rd < 256;rd++){
        int blu = 255;//hold the blue coordinate constant.
        pixel = picture.getPixel(p3dX(rd,grn,blu)+originX,
                                p3dY(rd,grn,blu)+originY);
        pixel.setColor(new Color(rd,grn,blu));
      }//end for loop
    }//end outer loop

    //Paint the right-most surface of the cube
    for(int grn = 0;grn < 256;grn++){
      for(int blu = 0;blu < 256;blu++){
        int rd = 255;//hold the red coordinate constant
        pixel = picture.getPixel(p3dX(rd,grn,blu)+originX,
                                p3dY(rd,grn,blu)+originY);
        pixel.setColor(new Color(rd,grn,blu));
      }//end for loop
    }//end outer loop

    //Force the world to repaint itself.
    mars.setVisible(false);
    mars.setVisible(true);
  }//end run
  //----------------------------------------------------//

}//end class Runner
|
If you understood the code in Listing 7, you should have no difficulty understanding the code in Listing 8.
Listing 8 also signals the end of the class named Runner and the end of the program.
The purpose of this program is to plot and display the values that result from computing the color-distances between a white pixel and an adjacent black pixel. The program also illustrates the usefulness of a Turtle object for plotting wiggly-line data, such as the red plots shown in Figure 5.
Black pixels on a white background
In this program, four groups of black pixels are placed in a white picture in a world. (If you look very closely, you can see the black pixels immediately below the centers of the red lines in Figure 4.)
The first group of black pixels actually isn't a group at all. Instead, it is a single black pixel on a horizontal row of white pixels near the top of Figure 4. The second group consists of two adjacent black pixels on a horizontal row of white pixels. The third group consists of three adjacent black pixels on a row of white pixels, and the fourth group consists of four adjacent black pixels on a row of white pixels at the bottom of Figure 4.
Compute and plot the color distances
The color-distance between adjacent pixels is computed and plotted as a red wiggly-line plot for each of the four rows of pixels containing black pixels in Figure 4.
The value of the color distance between adjacent white pixels or between adjacent black pixels is zero. The value of the color distance between a white pixel and a black pixel (regardless of the order) is approximately 441.67. This results in the red peaks (at the locations of the black pixels) in the wiggly-line plots shown in Figure 4 being quite large.
A more detailed description of the procedure
More specifically, the program traverses four specific rows of pixels from left to right on the image, computing the color distance between the color of the current pixel and the color of the pixel immediately to its right.
The color distance values for each traversal are saved in an array of type double. Then the program uses a turtle to plot the distance values as a red wiggly-line plot across the image with the baseline of the plot being one pixel above the row of pixels for which the distance values were computed.
As mentioned above, the peaks in the wiggly line correspond to locations on the row of pixels where there are abrupt changes in the color values from white to black or black to white.
The numeric results
I temporarily modified the program to print the numeric color-distance values as the program was running. The numeric values produced by the computation (in the vicinity of each group of black pixels) are shown in Figure 6.
Figure 6. Numeric color distance values.
Row Pix Color distance 123 208 0 123 209 441.6729559300637 123 210 441.6729559300637 123 211 0 246 208 0 246 209 441.6729559300637 246 210 0 246 211 441.6729559300637 246 212 0 369 208 0 369 209 441.6729559300637 369 210 0 369 211 0 369 212 441.6729559300637 369 213 0 492 208 0 492 209 441.6729559300637 492 210 0 492 211 0 492 212 0 492 213 441.6729559300637 492 214 0 |
And the numeric results were...
For the case of a single black pixel surrounded by white pixels in row 123, the color-distance computation resulted in two peaks with values of approximately 441.67 surrounded by values of zero. (The two peaks run together and appear as a single peak that is two pixels wide in Figure 4.)
For the case of two adjacent black pixels surrounded by white pixels in row 246, the color distance computation again resulted in two peaks with values of 441.67 surrounded by values of zero. However, in this case, the two peak values were separated by a value of zero and the two peaks are visually separable in Figure 4.
Finally, for the case of four adjacent black pixels surrounded by white pixels in row 492, the color distance computation resulted in two peaks with values of 441.67 surrounded by values of zero. In this case the two peak values were separated by three values of zero and are clearly visually separable in the bottom red plot in Figure 4.
An interpretation of the results
The interpretation of these results is that as the computation of color distance moves across a row of pixels from left to right, a strong peak is produced by the abrupt change from white to black and again by the abrupt change from black to white. In those areas where the color of two adjacent pixels is either white or black, the output of the color-distance computation is zero.
This knowledge can be used to understand the results that you saw in Figure 5 where you can see peaks on both sides of the nearly white spots on the nearly black butterfly wings.
Will discuss in fragments
A complete listing of the program named Java350b is provided in Listing 18 near the end of the lesson. As usual, I will explain the code in fragments.
The program begins in Listing 9 with code that is essentially the same as in the previous program.
Listing 9. Beginning of the program named Java350b
import java.awt.*;

public class Main{
  public static void main(String[] args){
    new Runner().run();
  }//end main
}//end class Main
|
Listing 9 instantiates a new object of the Runner class and calls the run method on that object.
Beginning of the Runner class and the run method
Listing 10 shows the beginning of the Runner class and the run method.
Listing 10. Beginning of the Runner class and the run method.
class Runner{
  void run(){

    //Create a new World object containing a default white
    // Picture object.
    int width = 420;
    int height = 493;
    World mars = new World(width,height);

    //Get a reference to the all-white picture that is
    // contained in the World object by default.
    Picture picture = mars.getPicture();

    //Create a new Turtle object and place it in the
    // default location at the center of the world. Make
    // the turtle invisible and set its pen color to RED.
    Turtle joe = new Turtle(mars);
    joe.setVisible(false);
    joe.setPenColor(Color.RED);

    //Create an array for storage of the color-distance
    // data.
    double[] distance = new double[width];

    //Loop and process four horizontal rows of pixels.
    for(int row = height/4,num = 1;row < height;
                                   row += height/4,num++){

      //Place adjacent black pixels at the center of each
      // row with the number of pixels ranging from 1 on
      // the first row to 4 on the last row.
      Pixel pix = null;
      for(int cntr = 0;cntr < num;cntr++){
        pix = picture.getPixel(cntr + width/2,row);
        pix.setColor(Color.BLACK);
      }//end for loop

      //Populate the array with the color-distances
      // between adjacent pixels for the specified row.
      getColorDistance(picture,row,distance);
|
Nothing new here
With the exception of the call to the getColorDistance method, there is nothing in Listing 10 that you haven't seen before. Therefore, this code shouldn't require much of an explanation beyond the embedded comments.
As before, this program instantiates a new World object containing a default Picture object producing an all white background. Then the code executes a for loop to process the four rows of pixels indicated by the red horizontal lines in Figure 4.
Near the beginning of this for loop, the program uses another short for loop to place the black pixels in the white background as explained earlier.
Then Listing 10 calls the getColorDistance method to compute the color-distance values for a specific row of pixels and uses that data to populate an array object of type double. At this point, I will put the run method on and explain the method named getColorDistance, which is shown in its entirety in Listing 11.
The getColorDistance method
This method populates an array of type double with the color distances between adjacent pixels on a specified row of a specified Picture object.
Listing 11. The getColorDistance method.
  void getColorDistance(
               Picture picture,int row,double[] distance){
    Pixel pix1;
    Pixel pix2;
    for(int cnt = 0;cnt < distance.length-1;cnt++){
      //Get two adjacent pixels in the specified row.
      pix1 = picture.getPixel(cnt,row);
      pix2 = picture.getPixel(cnt + 1,row);
      //Get and save the color distance between the two
      // pixels.
      distance[cnt] = pix1.colorDistance(pix2.getColor());
    }//end for loop
  }//end getColorDistance
|
Once again, what is the color distance?
I told you earlier that the color distance between two pixels is the positive length of a line segment that connects two points inside of or on the surface of the 3D color cube in Figure 3, where each point represents the color of a pixel. However, I didn't tell you how to compute that distance.
Ericson's colorDistance method
The truth is that you really don't need to know how to compute the color distance to program using Ericson's multimedia library. An object of Ericson's Pixel class provides a method named colorDistance that can be called to return the color distance between the current pixel and the color of another pixel. Listing 11 calls that method to compute the color distance between each pixel on the row and its neighbor immediately to its right.
Some insight might be helpful
However, I will provide some insight as to how the color distance is computed. You are probably already aware that you can use the Pythagorean Theorem to compute the distance between any two points in a 2D coordinate system. Using the x and y coordinates of the two points, you can construct the base and the opposite side of a right triangle where the hypotenuse of the triangle is the line segment that joins the two points. Then you can apply the Pythagorean Theorem to compute the length of the hypotenuse as the square root of the sum of the squares of the base and the opposite side of the right triangle. This will give you the distance between the two points.
A very similar process
Computing the distance between two points in 3D space involves a very similar process. Rather than to try to describe the process in words, I will simply show you Ericson's source code for the colorDistance method of the Pixel class (see Listing 12).
Listing 12. Source code for the Pixel's colorDistance method.
public double colorDistance(Color testColor){
  double redDistance = this.getRed() - testColor.getRed();
  double greenDistance =
                   this.getGreen() - testColor.getGreen();
  double blueDistance =
                     this.getBlue() - testColor.getBlue();
  double distance = Math.sqrt(
                           redDistance * redDistance +
                           greenDistance * greenDistance +
                           blueDistance * blueDistance);
  return distance;
}//end color distance method
|
If you examine the code in Listing 12, you should be able to see the similarity between this code and code that you would write to compute the distance between two points in 2D space.
Returning to the run method
Returning now to the run method, Listing 13 uses the turtle object in conjunction with the color distance data in the array referred to by the variable named distance to draw the red lines shown in Figure 4.
Listing 13. Plot the red wiggly line.
      //Baseline for wiggly line plot.
      int baseline = row-1;

      //Move the turtle to the right edge of the World
      // one pixel above the value of the row. Don't leave
      // a turtle track in the process.
      joe.setPenDown(false);
      joe.moveTo(width,baseline);
      joe.setPenDown(true);

      //Draw a baseline by moving turtle to the left side
      // of the world.
      joe.moveTo(0,baseline);

      //Draw the wiggly line. Change the sign of the
      // distance values to cause positive values to
      // peak upward on the screen.  Scale the distance
      // values down by a factor of 4. This should result
      // in a peak value of 110 pixels
      for(int cnt = 0;cnt < distance.length;cnt++){
        joe.moveTo(cnt+1,baseline-(int)(distance[cnt]/4));
      }//end inner for loop

    }//end outer for loop

  }//end run method
  //----------------------------------------------------//

}//end class Runner
|
There is nothing in Listing 13 that you haven't seen before, so no explanation should be required beyond the embedded comments.
Listing 13 also signals the end of the run method and the end of the program.
The purpose of this program is to provide a springboard for explaining the behavior of the edge-detection program that I will explain later.
This program displays an image of a butterfly on a World object as shown in Figure 5. Then it traverses four specific horizontal rows of pixels on the image, computing the color distance between the current pixel and the pixel immediately to its right. As in the previous program, the distance values are saved in an array of type double.
Plot color distance data as wiggly-line plots
Then the program uses a turtle to plot the distance values as a wiggly line across the image with the baseline of the plot being one pixel above the row of pixels for which the distance values were computed. The peaks in the wiggly line correspond to locations on the row of pixels where there are abrupt changes in the color values.
The color-distance values in Figure 5 are plotted to the same scale as the color distance values plotted by the program named Java350b in Figure 4. Therefore, those values, which show the maximum distance between a white pixel and a black pixel in Figure 4, can be used to visually calibrate the color distances associated with color changes in the butterfly image. None of the peaks in Figure 5 are as tall as the peaks in Figure 4, meaning that there are no cases in Figure 5 where the color changes from absolute black to absolute white.
Useful for edge detection
As you will see later, this technique is very useful for doing edge detection in order to produce results similar to those shown in Figure 2.
Very similar program code
As you may have guessed, this program is very similar to the program named Java350b. About the only difference is that this program loads the image of the butterfly into the world's Picture object instead of creating an image using program code by placing groups of black pixels on the default world's picture having a white background. Therefore, I won't bore you by explaining the code for this program. You will find a complete listing of the code in Listing 19 near the end of the lesson.
This is an edge-detection program. The program displays an image of a butterfly on a World object as shown in Figure 1. Then it traverses each horizontal row of pixels on the image, computing the color-distance between the color of the current pixel and the color of the pixel immediately to its right.
White pixels and black pixels
If the color-distance value is greater than a specified threshold, the color of the left-most pixel in the pair is changed to black. Otherwise, it is changed to white. The result is a picture resembling a pencil drawing of the butterfly as shown in Figure 2. Increasing the threshold value will decrease the number of black pixels in the output.
A relatively simple program
After having worked your way through the three earlier programs in this lesson, you may be surprised to learn how simple this edge-detection program really is. I suppose that means that it is much more difficult to explain how edge detection works than it is to actually perform edge detection on an image once you understand the process.
Source code for the program named Java350d
A complete listing of this program is provided in Listing 20 near the end of the lesson. This program begins just like the other programs in this lesson by instantiating an object of the Runner class and calling the run method on that object. The source code for the Runner method and the run class begins in Listing 14.
Listing 14. Beginning of the Runner class and run method for Java350d.
class Runner{
  void run(){
    //Clipping threshold for edge detection.
    int threshold = 18;

    //Create and display a Picture object using an image
    // file in the current directory.
    Picture picture = new Picture("butterfly1.jpg");
    picture.show();

    //Create a new World object and assign the above
    // Picture object to the World picture. Note that the
    // size of the world was set to be slightly smaller
    // than the size of the image, which is 422x497.
    int width = 420;
    int height = 493;
    World mars = new World(width,height);
    mars.setPicture(picture);
|
The variable named threshold
With the exception of the declaration of the variable named threshold, there is nothing new in Listing 14. As you will see later, the color distance values are compared to the threshold value to determine whether to replace the current pixel with a black pixel or a white pixel. Increasing the threshold value will typically decrease the number of black pixels.
Perform edge detection on the image
The remainder of the run method is shown in Listing 15.
Listing 15. Perform edge detection on the image.
    //Loop and process each horizontal rows of pixels
    // to produce the edge-detected output.
    for(int row = 0;row < height;row++){
      edgeDetector(picture,row,width,threshold);
    }//end outer for loop

    //Force a repaint
    mars.setVisible(false);
    mars.setVisible(true);

  }//end run method
|
Listing 15 uses a for loop to call the method named edgeDetector once for each row of pixels in the image. I'll explain that method shortly.
Force a repaint
In the meantime, the last two statements in Listing 15 force the world to be repainted. I found that without this code on my computer, the world is sometimes displayed in an incomplete state with part of the image having been edge-detected and part of the image still in its raw form. I also found that to be true for one of the earlier programs as well, but I forgot to mention it when I was explaining that program.
The edge detector method
The edge detector method is shown in its entirety in Listing 16.
Listing 16. The edge detector method.
  void edgeDetector(
         Picture picture,int row,int width,int threshold){
    Pixel pix1;
    Pixel pix2;
    for(int cnt = 0;cnt < width-1;cnt++){
      //Get two adjacent pixels in the specified row.
      pix1 = picture.getPixel(cnt,row);
      pix2 = picture.getPixel(cnt + 1,row);
      //Get and save the color distance between the two
      // pixels.
      double distance =
                      pix1.colorDistance(pix2.getColor());

      //Compare the color distance to the threshold and
      // change pixel color accordingly.
      if(distance > threshold){
        pix1.setColor(Color.BLACK);
      }else{
        pix1.setColor(Color.WHITE);
      }//end else

    }//end for loop
  }//end edgeDetector

}//end class Runner
|
Change pixels to either black or white
This method computes the color-distances between each pair of adjacent pixels on a specified row of a specified Picture object in a manner similar to the earlier program. However, in this case, if the value of the color distance is greater than a specified threshold, the color of the left-most pixel in the pair is changed to black. Otherwise, it is changed to white. This converts the image shown in Figure 1 into the image shown in Figure 2.
Other interesting variations on the same theme
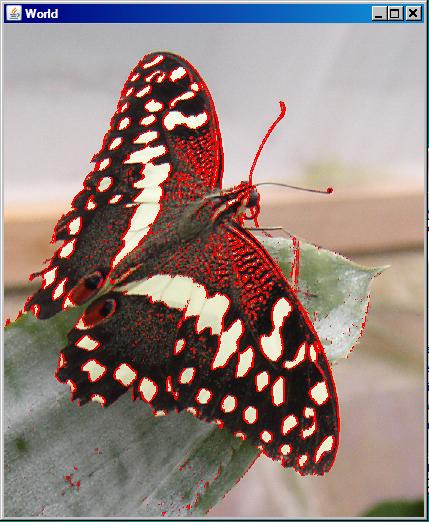
There are many interesting variations that you can apply to this process. For example, if you increase the threshold value to 54, change the color from BLACK to RED in Listing 16, and eliminate the else clause in Listing 16, you will produce the output image shown in Figure 7.
Figure 7. Another variation on edge detection.
|
|
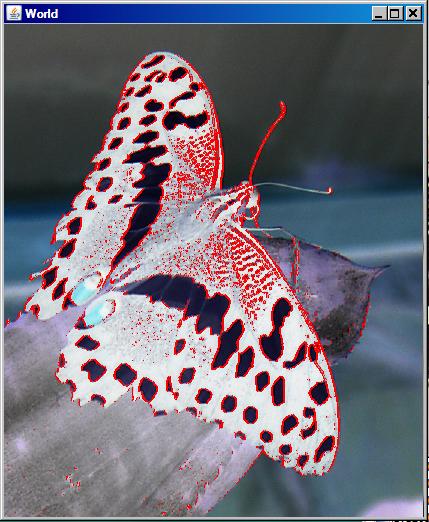
Butterfly with red outline and color inversion
If you increase the threshold value to 54, change the color from BLACK to RED in Listing 16, and invert the color of all the pixels that fall below the threshold, you will produce the output image shown in Figure 8. (I will explain how to invert pixel colors in a future lesson.)
Figure 8. Butterfly with red outline and color inversion.
|
|
|
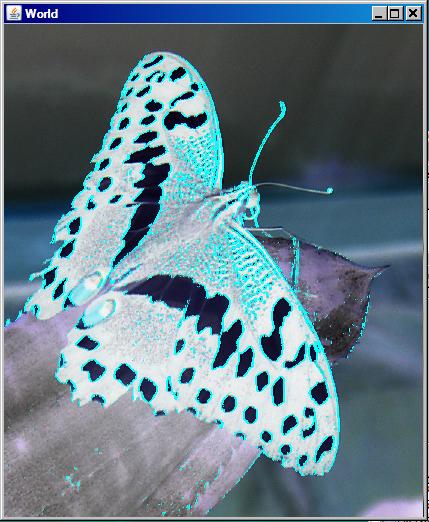
Butterfly with cyan outline and color inversion
If you increase the threshold value to 54, change the color from BLACK to CYAN in Listing 16, and invert the color of all the pixels that fall below the threshold, you will produce the output image shown in Figure 9.
Figure 9. Butterfly with cyan outline and color inversion.
|
|
And that's a wrap
That is the end of the program, and almost the end of the lesson.
I encourage you to copy the code from Listing 17 through Listing 20, compile the code, and execute it. Experiment with the code, making changes, and observing the results of your changes. Make certain that you can explain why your changes behave as they do.
I presented and explained four different programs in this lesson. The last program taught you how to do edge detection on an image. The first three programs were designed to help you understand how edge detection works. Those programs also taught you about color distance, and how to project 3D coordinates onto a 2D display plane.
In the next lesson, you will learn how to write a Java program to apply a blurring or softening filter to your digital photos with the amount of softening being controlled by a slider.
Listing 17. Source code for the program named Java350a.
/*********************************************************
Program Java350a
Copyright R.G.Baldwin, 2009
This program creates and displays a 3D color cube that
displays various combinations of red, green, and blue on
the top, the front, and the right-most side of the cube.

The purpose of the program is to provide a platform for
discussing the concept of the distance between two colors
as points in 3D space.  The positive red axis is toward
the right.  The positive green axis is up, and the
positive blue axis is toward the viewer.  The type of
projection that was used is a Cavalier projection with the
angle phi equal to 45 degrees.

See http://local.wasp.uwa.edu.au/~pbourke/geometry
/classification/ for more information on  projection
types.

Tested under Win XP using the Ericson multimedia library.
*********************************************************/
import java.awt.*;

public class Main{
  public static void main(String[] args){
    new Runner().run();
  }//end main
}//end class Main
//======================================================//

class Runner{
  final double sin45 = 0.7071067811865476;
  final double cos45 = 0.7071067811865476;
  final int width = 460;
  final int height = 460;
  final int originX = (int)(0.42*width);
  final int originY = (int)(0.59*height);
  World mars = null;
  //----------------------------------------------------//

  //The purpose of each of the following two methods is to
  // project a point in 3D space onto a 2D surface for
  // display using a Cavalier projection with the angle
  // phi equal to 45 degrees. This method returns the
  // 2D x-coordinate where the point is to be plotted.
  int p3dX(int red,int green,int blue){
    return (int)(red-blue*sin45);
  }//end p3Dx
  //----------------------------------------------------//

  //This method returns the 2D y-coordinate where the
  // point is to be plotted.
  int p3dY(int red,int green,int blue){
    //Reverse the sign to account for the fact that
    // positive y-coordinates go down the screen
    return -(int)(green-blue*cos45);
  }//end p3dY
  //----------------------------------------------------//

  void run(){
    //Create a new World object.
    mars = new World(width,height);

    //Place a new turtle on the right edge of the World
    // and make it invisible.
    Turtle joe = new Turtle(width,originY,mars);
    joe.setVisible(false);

    //Draw colored axes and black lines that outline the
    // cube.
    drawLines(joe);

    //Paint the top of the cube. Begin by getting a
    // reference to the Picture object that belongs to the
    // world by default.
    Picture picture = mars.getPicture();

    Pixel pixel = null;//a working variable

    for(int blu = 0;blu < 256;blu++){
      for(int rd = 0;rd < 256;rd++){
        //Hold the green coordinate constant.
        int grn = 255;
        pixel = picture.getPixel(p3dX(rd,grn,blu)+originX,
                                p3dY(rd,grn,blu)+originY);
        pixel.setColor(new Color(rd,grn,blu));
      }//end for loop
    }//end outer loop

    //Paint the front surface of the cube
    for(int grn = 0;grn < 256;grn++){
      for(int rd = 0;rd < 256;rd++){
        int blu = 255;//hold the blue coordinate constant.
        pixel = picture.getPixel(p3dX(rd,grn,blu)+originX,
                                p3dY(rd,grn,blu)+originY);
        pixel.setColor(new Color(rd,grn,blu));
      }//end for loop
    }//end outer loop

    //Paint the right-most surface of the cube
    for(int grn = 0;grn < 256;grn++){
      for(int blu = 0;blu < 256;blu++){
        int rd = 255;//hold the red coordinate constant
        pixel = picture.getPixel(p3dX(rd,grn,blu)+originX,
                                p3dY(rd,grn,blu)+originY);
        pixel.setColor(new Color(rd,grn,blu));
      }//end for loop
    }//end outer loop

    //Force the world to repaint itself.
    mars.setVisible(false);
    mars.setVisible(true);
  }//end run
  //----------------------------------------------------//

  //The purpose of this method is to draw colored axes
  // that represent the 3D space and black lines that
  // outline the cube. This is accomplished with turtle
  // tracks.  Note that because of the sequence in which
  // the world repaints itself, with the historical turtle
  // tracks being drawn last, these lines will be drawn on
  // top of the colored pixels that color the sides of the
  // cube. This makes it look like the sides of the cube
  // are transparent. I put this code in a separate method
  // simply to provide better organization for the
  // program.
  void drawLines(Turtle joe){
    //Draw red x-axis by moving the turtle from the right
    // edge to the origin of the 3D world.
    joe.setPenWidth(2);//Draw the colored axes wide.
    joe.setPenColor(Color.RED);
    joe.moveTo(p3dX(0,0,0)+originX,p3dY(0,0,0)+originY);

    //Draw green y-axis by moving the turtle to near the
    // top edge of the 3D world and then return to the
    // origin.
    joe.setPenColor(Color.GREEN);
    joe.moveTo(p3dX(0,265,0)+originX,
               p3dY(0,265,0)+originY);
    joe.moveTo(p3dX(0,0,0)+originX,
               p3dY(0,0,0)+originY);

    //Draw blue axis and return turtle to the origin of
    // the 3D world.
    joe.setPenColor(Color.BLUE);
    joe.moveTo(p3dX(0,0,265)+originX,
               p3dY(0,0,265)+originY);
    joe.moveTo(p3dX(0,0,0)+originX,
               p3dY(0,0,0)+originY);

    joe.setPenWidth(1);//Draw narrow black lines.
    joe.setPenColor(Color.BLACK);

    //Draw four lines that outline the base of a cube. The
    // size of the cube is 256 pixels on each side.
    joe.moveTo(p3dX(0,0,255)+originX,
               p3dY(0,0,255)+originY);
    joe.moveTo(p3dX(255,0,255)+originX,
               p3dY(255,0,255)+originY);
    joe.moveTo(p3dX(255,0,0)+originX,
               p3dY(255,0,0)+originY);
    joe.moveTo(p3dX(0,0,0)+originX,
               p3dY(0,0,0)+originY);

    //Move up and draw four lines that outline the top of
    // the cube.
    joe.moveTo(p3dX(0,255,0)+originX,
               p3dY(0,255,0)+originY);
    joe.moveTo(p3dX(0,255,255)+originX,
               p3dY(0,255,255)+originY);
    joe.moveTo(p3dX(255,255,255)+originX,
               p3dY(255,255,255)+originY);
    joe.moveTo(p3dX(255,255,0)+originX,
               p3dY(255,255,0)+originY);
    joe.moveTo(p3dX(0,255,0)+originX,
               p3dY(0,255,0)+originY);

    //Draw three vertical lines at the corners.
    joe.moveTo(p3dX(0,255,255)+originX,
               p3dY(0,255,255)+originY);
    joe.moveTo(p3dX(0,0,255)+originX,
               p3dY(0,0,255)+originY);

    joe.moveTo(p3dX(255,0,255)+originX,
               p3dY(255,0,255)+originY);
    joe.moveTo(p3dX(255,255,255)+originX,
               p3dY(255,255,255)+originY);

    joe.moveTo(p3dX(255,255,0)+originX,
               p3dY(255,255,0)+originY);
    joe.moveTo(p3dX(255,0,0)+originX,
               p3dY(255,0,0)+originY);

  }//end drawLines

}//end class Runner
|
Listing 18. Source code for the program named Java350b.
/*********************************************************
Program Java350b
Copyright R.G.Baldwin, 2009

The purpose of this program is to plot and display the
values resulting from computing the color-distances
between white pixels and black pixel.

The program also illustrates the usefulness of a Turtle
object for plotting wiggly-line data.

Four groups of black pixels are placed in a white picture.
The first group is a single black pixel on a horizontal
row of pixels.  The second group consists of two adjacent
black pixels on a horizontal row of pixels.  The third
group consists of three adjacent black pixels, and the
fourth group consists of four adjacent black pixels.

The color-distance between adjacent pixels is computed,
plotted, and displayed for each row of pixels containing
black pixels.

The color distance between a white pixel and a black pixel
is 441.67.

More specifically, the program traverses four specific
rows of pixels on the image, computing the color distance
between the color of the current pixel and the color of
the pixel immediately to its right.  The distance values
are saved in an array of type double.  Then the program
uses a turtle to plot the distance values as a wiggly
line across the image with the baseline of the plot being
one pixel above the row of pixels for which the distance
values were computed.

The peaks in the wiggly line correspond to locations on
the row of pixels where there are abrupt changes in the
color values.

Tested under Win XP using the Ericson multimedia library.
*********************************************************/
import java.awt.*;

public class Main{
  public static void main(String[] args){
    new Runner().run();
  }//end main
}//end class Main
//======================================================//

class Runner{
  void run(){

    //Create a new World object containing a default white
    // Picture object.
    int width = 420;
    int height = 493;
    World mars = new World(width,height);

    //Get a reference to the all-white picture that is
    // contained in the World object by default.
    Picture picture = mars.getPicture();

    //Create a new Turtle object and place it in the
    // default location at the center of the world. Make
    // the turtle invisible and set its pen color to RED.
    Turtle joe = new Turtle(mars);
    joe.setVisible(false);
    joe.setPenColor(Color.RED);

    //Create an array for storage of the color-distance
    // data.
    double[] distance = new double[width];

    //Loop and process four horizontal rows of pixels.
    for(int row = height/4,num = 1;row < height;
                                   row += height/4,num++){

      //Place adjacent black pixels at the center of each
      // row with the number of pixels ranging from 1 on
      // the first row to 4 on the last row.
      Pixel pix = null;
      for(int cntr = 0;cntr < num;cntr++){
        pix = picture.getPixel(cntr + width/2,row);
        pix.setColor(Color.BLACK);
      }//end for loop

      //Populate the array with the color-distances
      // between adjacent pixels for the specified row.
      getColorDistance(picture,row,distance);

      //Baseline for wiggly line plot.
      int baseline = row-1;

      //Move the turtle to the right edge of the World
      // one pixel above the value of the row. Don't leave
      // a turtle track in the process.
      joe.setPenDown(false);
      joe.moveTo(width,baseline);
      joe.setPenDown(true);

      //Draw a baseline by moving turtle to the left side
      // of the world.
      joe.moveTo(0,baseline);

      //Draw the wiggly line. Change the sign of the
      // distance values to cause positive values to
      // peak upward on the screen.  Scale the distance
      // values down by a factor of 4. This should result
      // in a peak value of 110 pixels
      for(int cnt = 0;cnt < distance.length;cnt++){
        joe.moveTo(cnt+1,baseline-(int)(distance[cnt]/4));
      }//end inner for loop

    }//end outer for loop

  }//end run method
  //----------------------------------------------------//

  //This method populates an array of type double with the
  // color distances between adjacent pixels on a
  // specified row of a specified Picture object.
  void getColorDistance(
               Picture picture,int row,double[] distance){
    Pixel pix1;
    Pixel pix2;
    for(int cnt = 0;cnt < distance.length-1;cnt++){
      //Get two adjacent pixels in the specified row.
      pix1 = picture.getPixel(cnt,row);
      pix2 = picture.getPixel(cnt + 1,row);
      //Get and save the color distance between the two
      // pixels.
      distance[cnt] = pix1.colorDistance(pix2.getColor());
    }//end for loop
  }//end getColorDistance

}//end class Runner
|
Listing 19. Source code for the program named Java350c.
/*********************************************************
Program Java350c
Copyright R.G.Baldwin, 2009

The purpose of this program is to provide a platform for
explaining the behavior of edge-detection programs.

The program displays an image of a butterfly on a World
object.  Then it traverses four specific horizontal rows
of pixels on the image, computing the color distance
between the color of the current pixel and the color of
the pixel immediately to its right.  The distance values
are saved in an array of type double.  Then the program
uses a turtle to plot the distance values as a wiggly line
across the image with the baseline of the plot being one
pixel above the row of pixels for which the distance
values were computed.

The peaks in the wiggly line correspond to locations on
the row of pixels where there are abrupt changes in the
color values. The color-distance values are plotted to the
same scale as the values plotted in the program named
Java350b.  Therefore, those values, which show the maximum
distance between a white pixel and a black pixel, can be
used to visually calibrate the color distances associated
with color changes in the butterfly image.

This technique is useful for doing edge detection.

Tested under Win XP using the Ericson multimedia library.
*********************************************************/
import java.awt.*;

public class Main{
  public static void main(String[] args){
    new Runner().run();
  }//end main
}//end class Main
//======================================================//

class Runner{
  void run(){
    //Create a Picture object using an image file in the
    // current directory.
    Picture picture = new Picture("butterfly1.jpg");

    //Create a new World object and assign the above
    // Picture object to the World picture. Note that the
    // size of the world was matched to the size of the
    // image.
    int width = 420;
    int height = 493;
    World mars = new World(width,height);
    mars.setPicture(picture);

    //Create a new Turtle object and place it in the
    // default location at the center of the world. Make
    // the turtle invisible and set its pen color to
    // RED.
    Turtle joe = new Turtle(mars);
    joe.setVisible(false);
    joe.setPenColor(Color.RED);

    //Create an array for storage of the color-distance
    // data.
    double[] distance = new double[width];

    //Loop and process four horizontal rows of pixels.
    for(int row = height/4;row < height;row += height/4){

      //Populate the array with the color-distances
      // between adjacent pixels for the specified row.
      getColorDistance(picture,row,distance);

      //Baseline for wiggly line plot.
      int baseline = row-1;

      //Move the turtle to the right edge of the World
      // one pixel above the value of the row. Don't leave
      // a turtle track in the process.
      joe.setPenDown(false);
      joe.moveTo(width,baseline);
      joe.setPenDown(true);

      //Draw a baseline by moving the turtle to the left
      // side of the world.
      joe.moveTo(0,baseline);

      //Draw the wiggly line. Change the sign of the
      // distance values to cause positive values to
      // peak upward on the screen.  Scale the distance
      // values down by a factor of 4.
      for(int cnt = 0;cnt < distance.length-1;cnt++){
        joe.moveTo(cnt+1,baseline-(int)(distance[cnt]/4));
      }//end inner for loop

    }//end outer for loop

  }//end run method
  //----------------------------------------------------//

  //This method populates an array of type double with the
  // color distances between adjacent pixels on a
  // specified row of a specified Picture object.
  void getColorDistance(
               Picture picture,int row,double[] distance){
    Pixel pix1;
    Pixel pix2;
    for(int cnt = 0;cnt < distance.length-1;cnt++){
      //Get two adjacent pixels in the specified row.
      pix1 = picture.getPixel(cnt,row);
      pix2 = picture.getPixel(cnt + 1,row);
      //Get and save the color distance between the two
      // pixels.
      distance[cnt] = pix1.colorDistance(pix2.getColor());
    }//end for loop
  }//end getColorDistance

}//end class Runner
|
Listing 20. Source code for the program named Java350d.
/*********************************************************
Program Java350c
Copyright R.G.Baldwin, 2009

This is an edge-detection program.

The program displays an image of a butterfly on a World
object.  Then it traverses each horizontal row of pixels
on the image, computing the color-distance between the
color of the current pixel and the color of the pixel
immediately to its right.  If the color-distance value is
greater than a specified threshold, the color of the
left-most pixel in the pair is changed to black.
Otherwise, it is changed to white.

The result is a picture resembling a pencil drawing of the
butterfly. Increasing the threshold value decreases the
number of black pixels in the output.

Tested under Win XP using the Ericson multimedia library.
*********************************************************/
import java.awt.*;

public class Main{
  public static void main(String[] args){
    new Runner().run();
  }//end main
}//end class Main
//======================================================//

class Runner{
  void run(){
    //Clipping threshold for edge detection.
    int threshold = 18;

    //Create and display a Picture object using an image
    // file in the current directory.
    Picture picture = new Picture("butterfly1.jpg");
    picture.show();

    //Create a new World object and assign the above
    // Picture object to the World picture. Note that the
    // size of the world was set to be slightly smaller
    // than the size of the image, which is 422x497.
    int width = 420;
    int height = 493;
    World mars = new World(width,height);
    mars.setPicture(picture);

    //Loop and process each horizontal rows of pixels
    // to produce the edge-detected output.
    for(int row = 0;row < height;row++){
      edgeDetector(picture,row,width,threshold);
    }//end outer for loop

    //Force a repaint
    mars.setVisible(false);
    mars.setVisible(true);

  }//end run method
  //----------------------------------------------------//

  //This method computes the color-distances between each
  // pair of adjacent pixels on a specified row of a
  // specified Picture object. If the value is greater
  // than a specified threshold, the color of the
  // left-most pixel in the pair is changed to black.
  // Otherwise, it is changed to white.
  void edgeDetector(
         Picture picture,int row,int width,int threshold){
    Pixel pix1;
    Pixel pix2;
    for(int cnt = 0;cnt < width-1;cnt++){
      //Get two adjacent pixels in the specified row.
      pix1 = picture.getPixel(cnt,row);
      pix2 = picture.getPixel(cnt + 1,row);
      //Get and save the color distance between the two
      // pixels.
      double distance =
                      pix1.colorDistance(pix2.getColor());

      //Compare the color distance to the threshold and
      // change pixel color accordingly.
      if(distance > threshold){
        pix1.setColor(Color.BLACK);
      }else{
        pix1.setColor(Color.WHITE);
      }//end else

    }//end for loop
  }//end edgeDetector

}//end class Runner
|
Copyright 2009, Richard G. Baldwin. Reproduction in whole or in part in any form or medium without express written permission from Richard Baldwin is prohibited.
Richard has participated in numerous consulting projects and he frequently provides onsite training at the high-tech companies located in and around Austin, Texas. He is the author of Baldwin's Programming Tutorials, which have gained a worldwide following among experienced and aspiring programmers. He has also published articles in JavaPro magazine.
In addition to his programming expertise, Richard has many years of practical experience in Digital Signal Processing (DSP). His first job after he earned his Bachelor's degree was doing DSP in the Seismic Research Department of Texas Instruments. (TI is still a world leader in DSP.) In the following years, he applied his programming and DSP expertise to other interesting areas including sonar and underwater acoustics.
Richard holds an MSEE degree from Southern Methodist University and has many years of experience in the application of computer technology to real-world problems.
-end-